

服务
一月GTA销量止跌 公寓销量价格双降
据多伦多地产局今天(周二)公布的报告,在刚刚过去的2013年1月份,大多伦多地区的房屋成交量为4375宗,比去年同期的4432宗略有下降,止住了从去下夏秋开始、本地房屋成交量动辄百分之十几乃至百分之几十的下滑。
就地区来看,多伦多市内(416地区)各类房屋的成交量仍然没有止住跌势,镇屋下降了11.2%,居全区各类房屋之首。905地区则录得些许上涨。特别是该区的独立屋,成交量年同比上扬了3.7%。不过,905地区的公寓房成交量年同比仍下降了6.4%。
当月本地区的平均房价为48.26万元,比去年一月的46.27万元上涨4.3%。更精确体现房价变化的MLS屋价指数(HPI)则年同比上升了3.8个百分点。
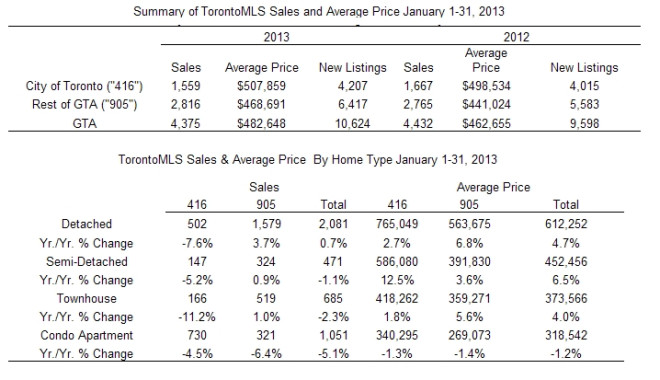
在全区各类房屋中,价格涨幅最大的是市内的半独立屋,12.5%;其次是905地区的独立屋,6.8%。虽然多伦多房市遭遇冷却,但是独立屋、半独立屋的房价增长仍较为稳定。相比之下,公寓房——无论是市内的还是905地区的成绩皆不佳,一月份成交价分别下降了1.3%和1.4%。
地产局主席汉娜女士(Ann Hannah)表示,一月份的数据令人满意,是个不错的新年新开头。虽然成交量年同比有所下滑,但是降幅比去年下半年少得多。本地一些买家曾受去年联邦收紧按揭条例影响不敢入市,而现在也渐渐地活跃起来。
至于905地区的房屋成交量的涨幅远好于市内,汉娜女士解释,这是受到多伦多开征土地转让税的影响。她再次敦促市府取消这一影响房地产业发展的税项。
地产局高级市场分析经理门瑟(Jason Mercer)则表示,在今年一月份,市场上仍然有足够买家竞争抢offer的现象来推动房价上涨,这为今年带来了一个好的开头。他估计,今年多伦多地区的平均房价将上涨3%至5%。
生活服务
實際上,買房就像買股票一樣,有人看漲,有人看跌!
如果你看加拿大近年來的房價,你會知道,自2000年來,房價漲了一倍還要翻兩個跟頭!
就是在經濟最不景氣的2008年,房價也沒見跌!漲了0.8%。
有人把房價高漲歸于2008年來的低利率,實際上,從2000年來,房價每年上漲的幅度都差不多(2008年除外)。
每年都有那么多新移民過來,這些人都需要房子住,所以房子的需求量不會下降太多。
我想,除非,加拿大不移民了,就沒房子的需求了,房價會大跌。
另外,就是像上世紀90年代的經濟大衰退,整個經濟徹底跨臺;或者比2008年還嚴重的衰退。
只有這樣的情況出現,房價才會出現大的下跌。
但我想,在這里,看房子只否會漲跌的人,應都不希望加拿大出現大的經濟蕭條。如果真的蕭條了,那時,你也不會或沒錢,更沒膽買房了!
對每一個已經買房的人,房子的漲跌對你自己沒有多大的關系,頂多就找個精神安慰。看見漲,你覺得買的合算了,看見跌,你覺得買虧了。
但你已經買了,漲跌除影響你心情外,與你真的沒太大的關系:除非你準備以大房換小房,你才會希望房子漲,否則,房價跌可能對你更有益。
如果你交過幾年地稅后,你就知道這樣一個事實:房子漲,意味著你交的地稅也得跟著漲,現在每個市都在把你的房子價錢抬起來,以便政府能夠從你那收更多的稅!
回复
跌了好,正好低价入市。
胆小的就看热闹吧。看了太多移民到加拿大十多年还在租房住的人,十年前就嫌贵,后来发现越来越贵。多伦多的房价怎么会跌呢?短期跌跌是正常现象,长期就一个字:涨。
多伦多的房价和北京上海相比已经很幸福了。
回复
http://www.wenxuecity.com/news/2013/02/11/2227241.html
回复
看跌!
回复
http://www.torontorealestateboard.com/market_news/release_market_updates/news2013/nr_comm_watch_0113.htm
回复
GTA Commercial REALTORS? Report Commercial Market Figures
TORONTO, February 5, 2013 -- Toronto Real Estate Board (TREB) Commercial Division Members reported almost 392,000 square feet of leased industrial, commercial/retail and office space through the TorontoMLS system in January of 2013. This result, for properties sold on a per square foot net basis and for which pricing was disclosed at time of reporting, was down by approximately 15 per cent in comparison to January 2012.
More than 75 per cent of space leased in January involved industrial properties. The amount of leased industrial space was down by close to 25 per cent compared to January 2012. The average lease rate was $5.25 per square foot net. This average rate represented an 11 per cent increase compared to January 2012.
“A slow recovery in the export sector has presented headwinds for the industrial sector. However, the consensus outlook is for continued economic growth in 2013 in Canada. It is felt that improving global economic conditions will bolster exports. With this outlook in mind, it is likely that some industrial firms who put real estate investment on hold will once again become active in the market,” said TREB Commercial Division Chair Cynthia Lai.
There were a combined 40 industrial, commercial/retail and office transactions in January – down from 58 sales in January 2012. The change in the average selling price per square foot was mixed and remained somewhat volatile on a year-over-year basis due to changes in the type, size and location of properties sold in January 2013 versus January 2012.
“The large annual rate of price growth for industrial properties was due to the fact that no property larger than 50,000 square feet sold this past January versus four such transactions in January 2012. Larger properties generally sell at a lower price per square foot,” said Lai.
“In the office market, the overall average selling price for January was up substantially over last year because the geographic breakdown of sales changed. This year there were more office transactions in the City of Toronto. All else being equal, office selling prices in the City of Toronto are higher compared to surrounding regions,” continued Lai.
January 2013: Per Square Foot Net Commercial Leasing Summary
Lease Transactions Completed on a Per Square Foot Net Basis with Pricing Disclosed on TorontoMLS
Leased Sq. Ft. (Price Disclosed, Per Sq.Ft. Net)
Avg. Lease Rate (Price Disclosed, Per Sq.Ft. Net)
Jan. 2013
Jan. 2012
% Change
Jan. 2013
Jan. 2012
% Change
Industrial
298,284
395,943
-24.7%
Industrial
$5.25
$4.73
11.1%
Commercial
65,315
21,611
202.2%
Commercial
$15.91
$21.66
-26.5%
Office
28,285
43,488
-35.0%
Office
$10.81
$10.20
5.9%
Total
391,884
461,042
-15.0%
Source: TREB Commercial Division
January 2013: Commercial Sales Completed with Pricing Disclosed on TorontoMLS
Sales (Price Disclosed)
Avg. Sale Price Per Sq. Ft. (Pricing Disclosed)
Jan. 2013
Jan. 2012
% Change
Jan. 2013
Jan. 2012
% Change
Industrial
17
27
-37.0%
Industrial
$119.96
$60.27
99.0%
Commercial
17
22
-22.7%
Commercial
$92.18
$149.52
-38.3%
Office
6
9
-33.3%
Office
$325.25
$172.12
89.0%
Total
40
58
-31.0%
回复
查看全部 78 条评论
查看全部 78 条评论
![[集市好物]2024 Toyota Corolla](https://storage.51yun.ca/auto-car-photos/9eac5795-1311-488e-913a-f55a032f4a62.1080x810.jpg)

网友评论